One percentage, 21 dams: how to read Cyprus's water figures
Oct. 23, 2026
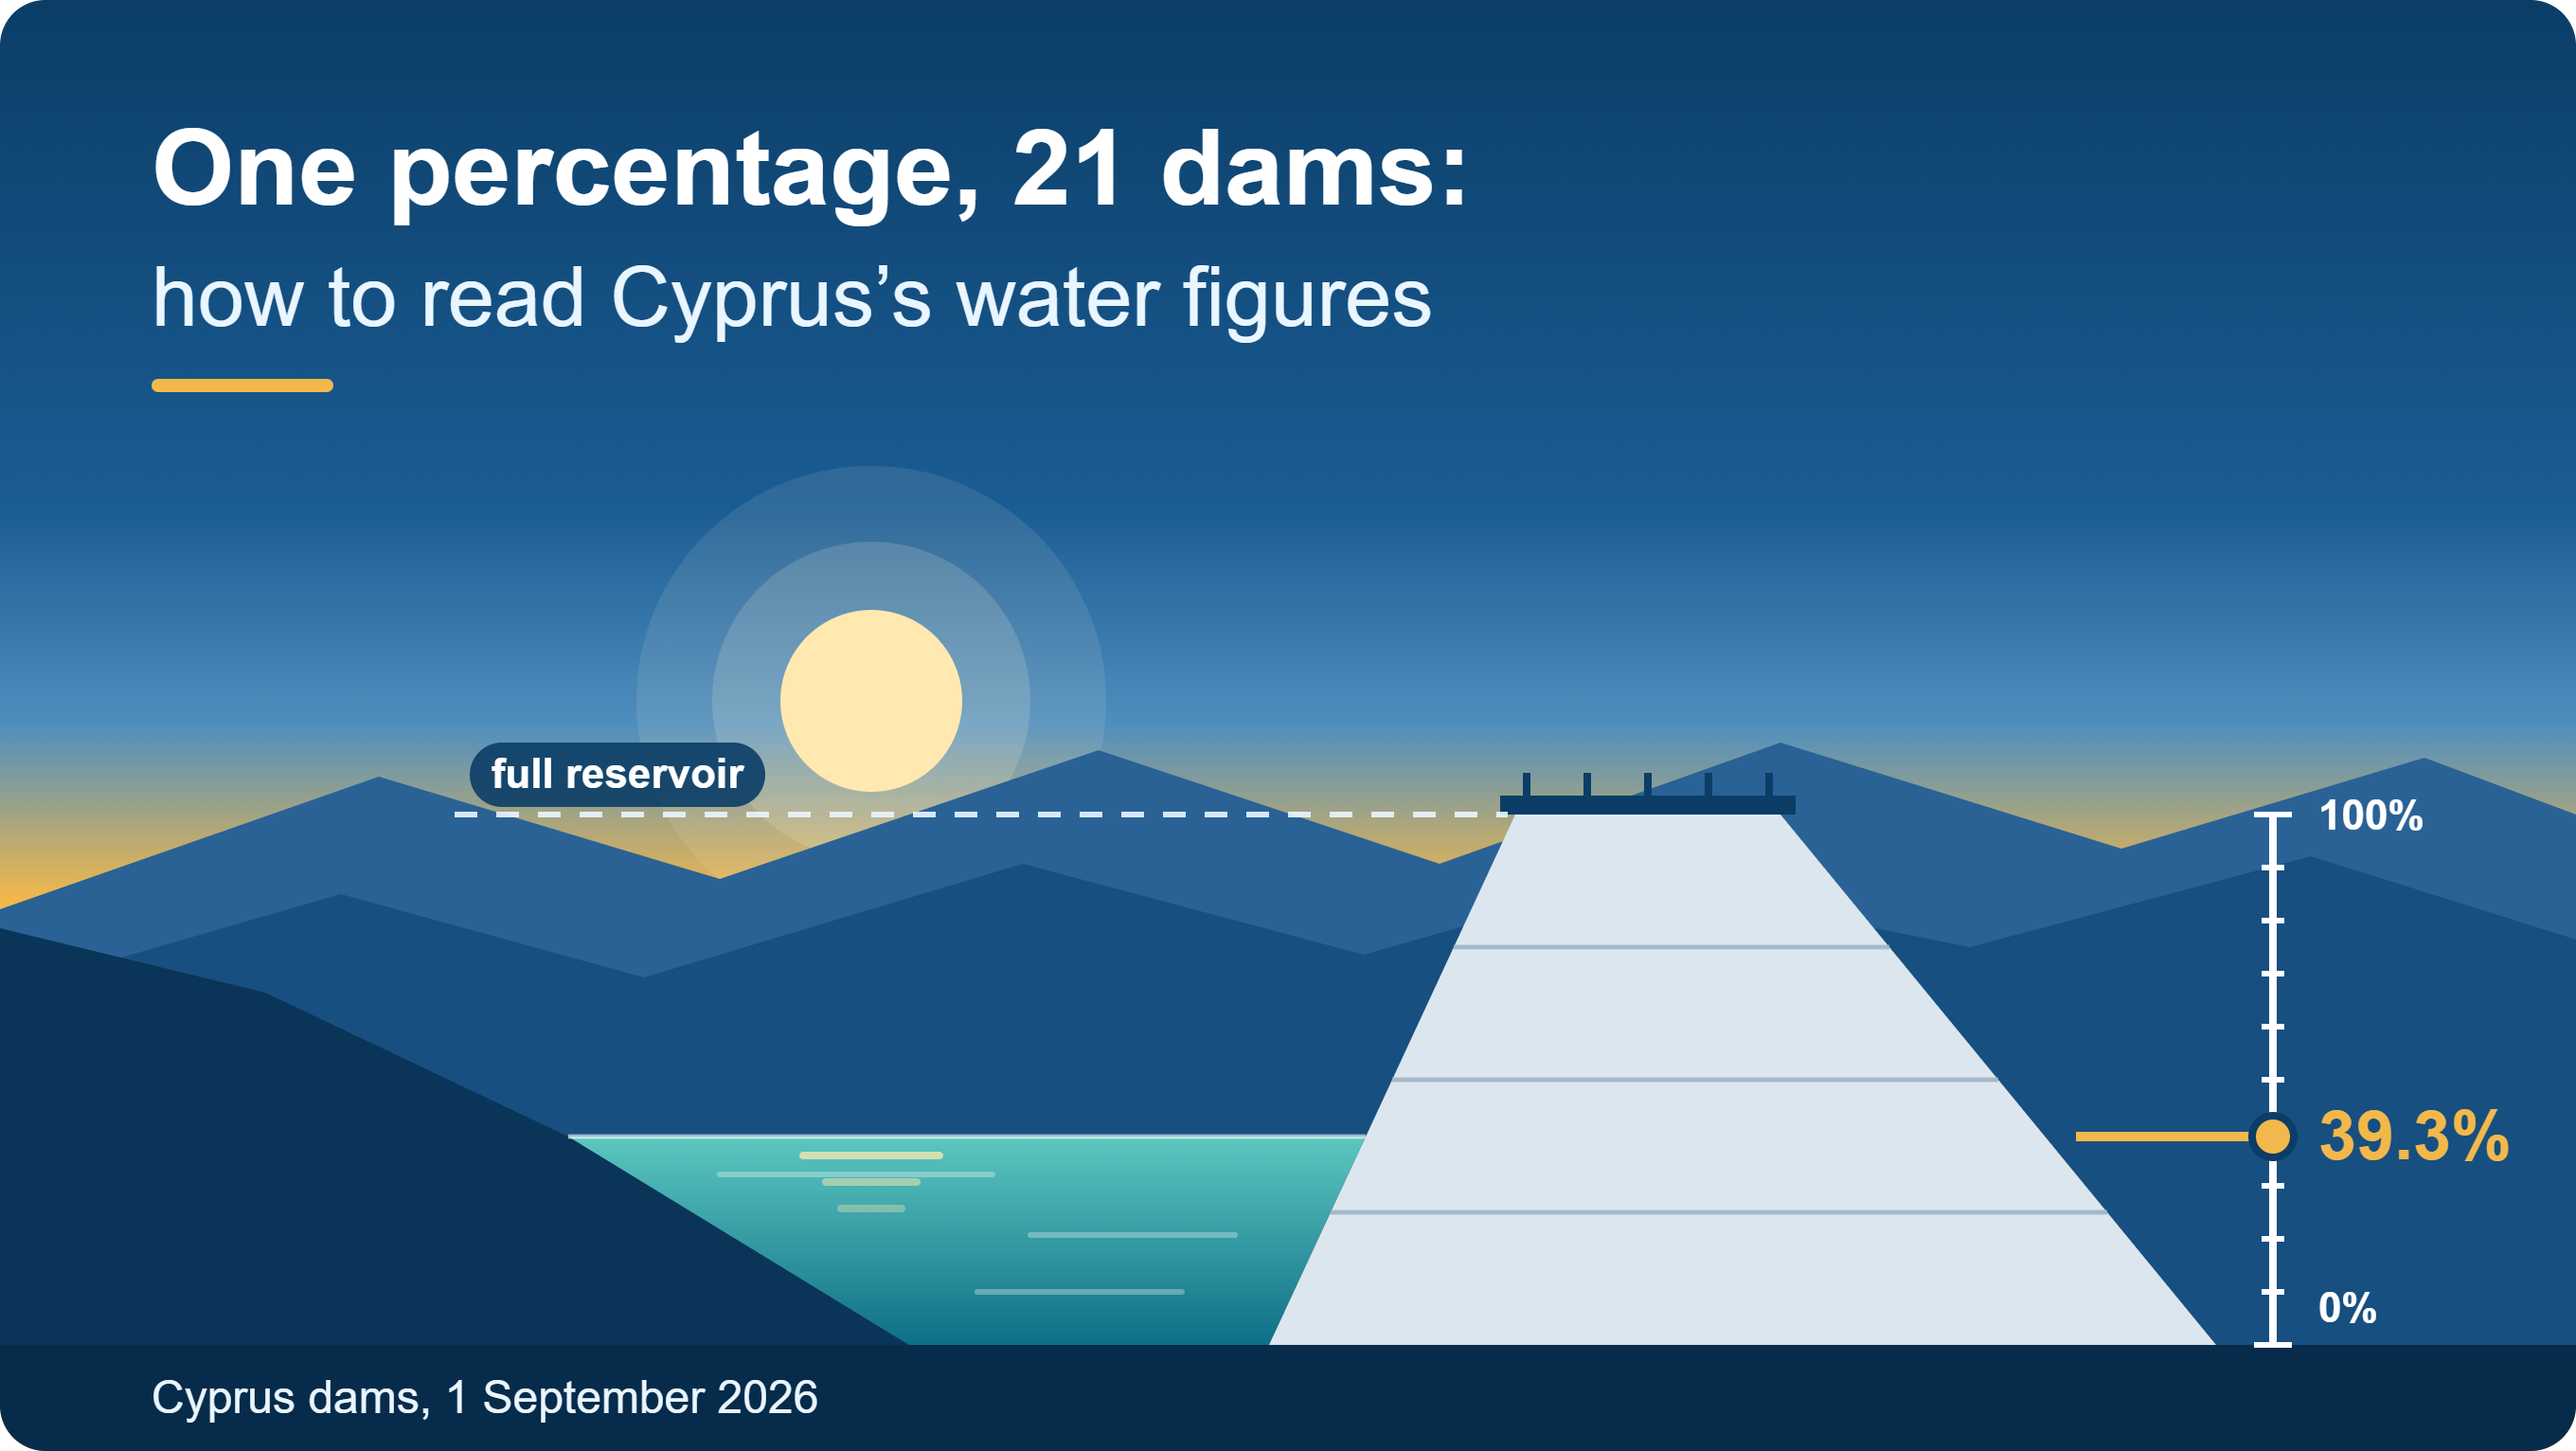
On 1st September 2026, Cyprus dam levels stood at 39.3%, with 117.9 million cubic metres of water stored, according to figures published by the Water Development Department. A year earlier, the same measure read 15.5%. One number covering 21 dams is easy to repeat and easy to misread.
What the percentage measures
The headline figure is simple arithmetic: the water stored in all the dams, divided by what they could hold together. The 21 dams have a combined capacity of about 300 million cubic metres, and 117.9 divided by 300 gives 39.3%. Think of a fuel gauge reading the average across 21 tanks of very different sizes. It tells you how much fuel there is in total. It says nothing about which tanks are empty.
Compared with what
The same dams give different readings. In mid-February they were around 14% full. By 1st September, they were above 39 %, yet still well below September 2022, when the figure was 76 per cent. In the three months to September, reserves fell by around 7 million cubic metres as evaporation increased. So 39.3 per cent is a good result against last year, a modest one against 2022 and it was drifting down when it was measured.
The same average, very different dams
On 1st September, the 21 dams fell into five bands. Four were above 85%, three between 68 and 85, four between 51 and 68, six between 35 and 51 and four below 35. Lefkara stood at 18% and Kalavasos at 23%.
The fullest dam deserves a second look. Kalopanayiotis was at 100%, but it is the country's smallest dam and holds just 0.3 million cubic metres when full, about a thousandth of the national total. A full small dam and a half-empty large one can sit in the same average. Location matters too. On 2nd October, all four reservoirs in the Larnaca and Ammochostos districts were fuller than a year earlier, and Kalavasos was still only 21.8% full.
Three questions for any water figure
- Which dams does it include, and how big are they?
- What date does it describe?
- Compared with which year?
Asking all three takes a few seconds and turns a headline into information. The department itself treats the headline with caution. Earlier this year, with dams at 33.9% and above the previous year, its chief technical engineer called the situation not satisfactory enough to be carefree.
Beyond the dams
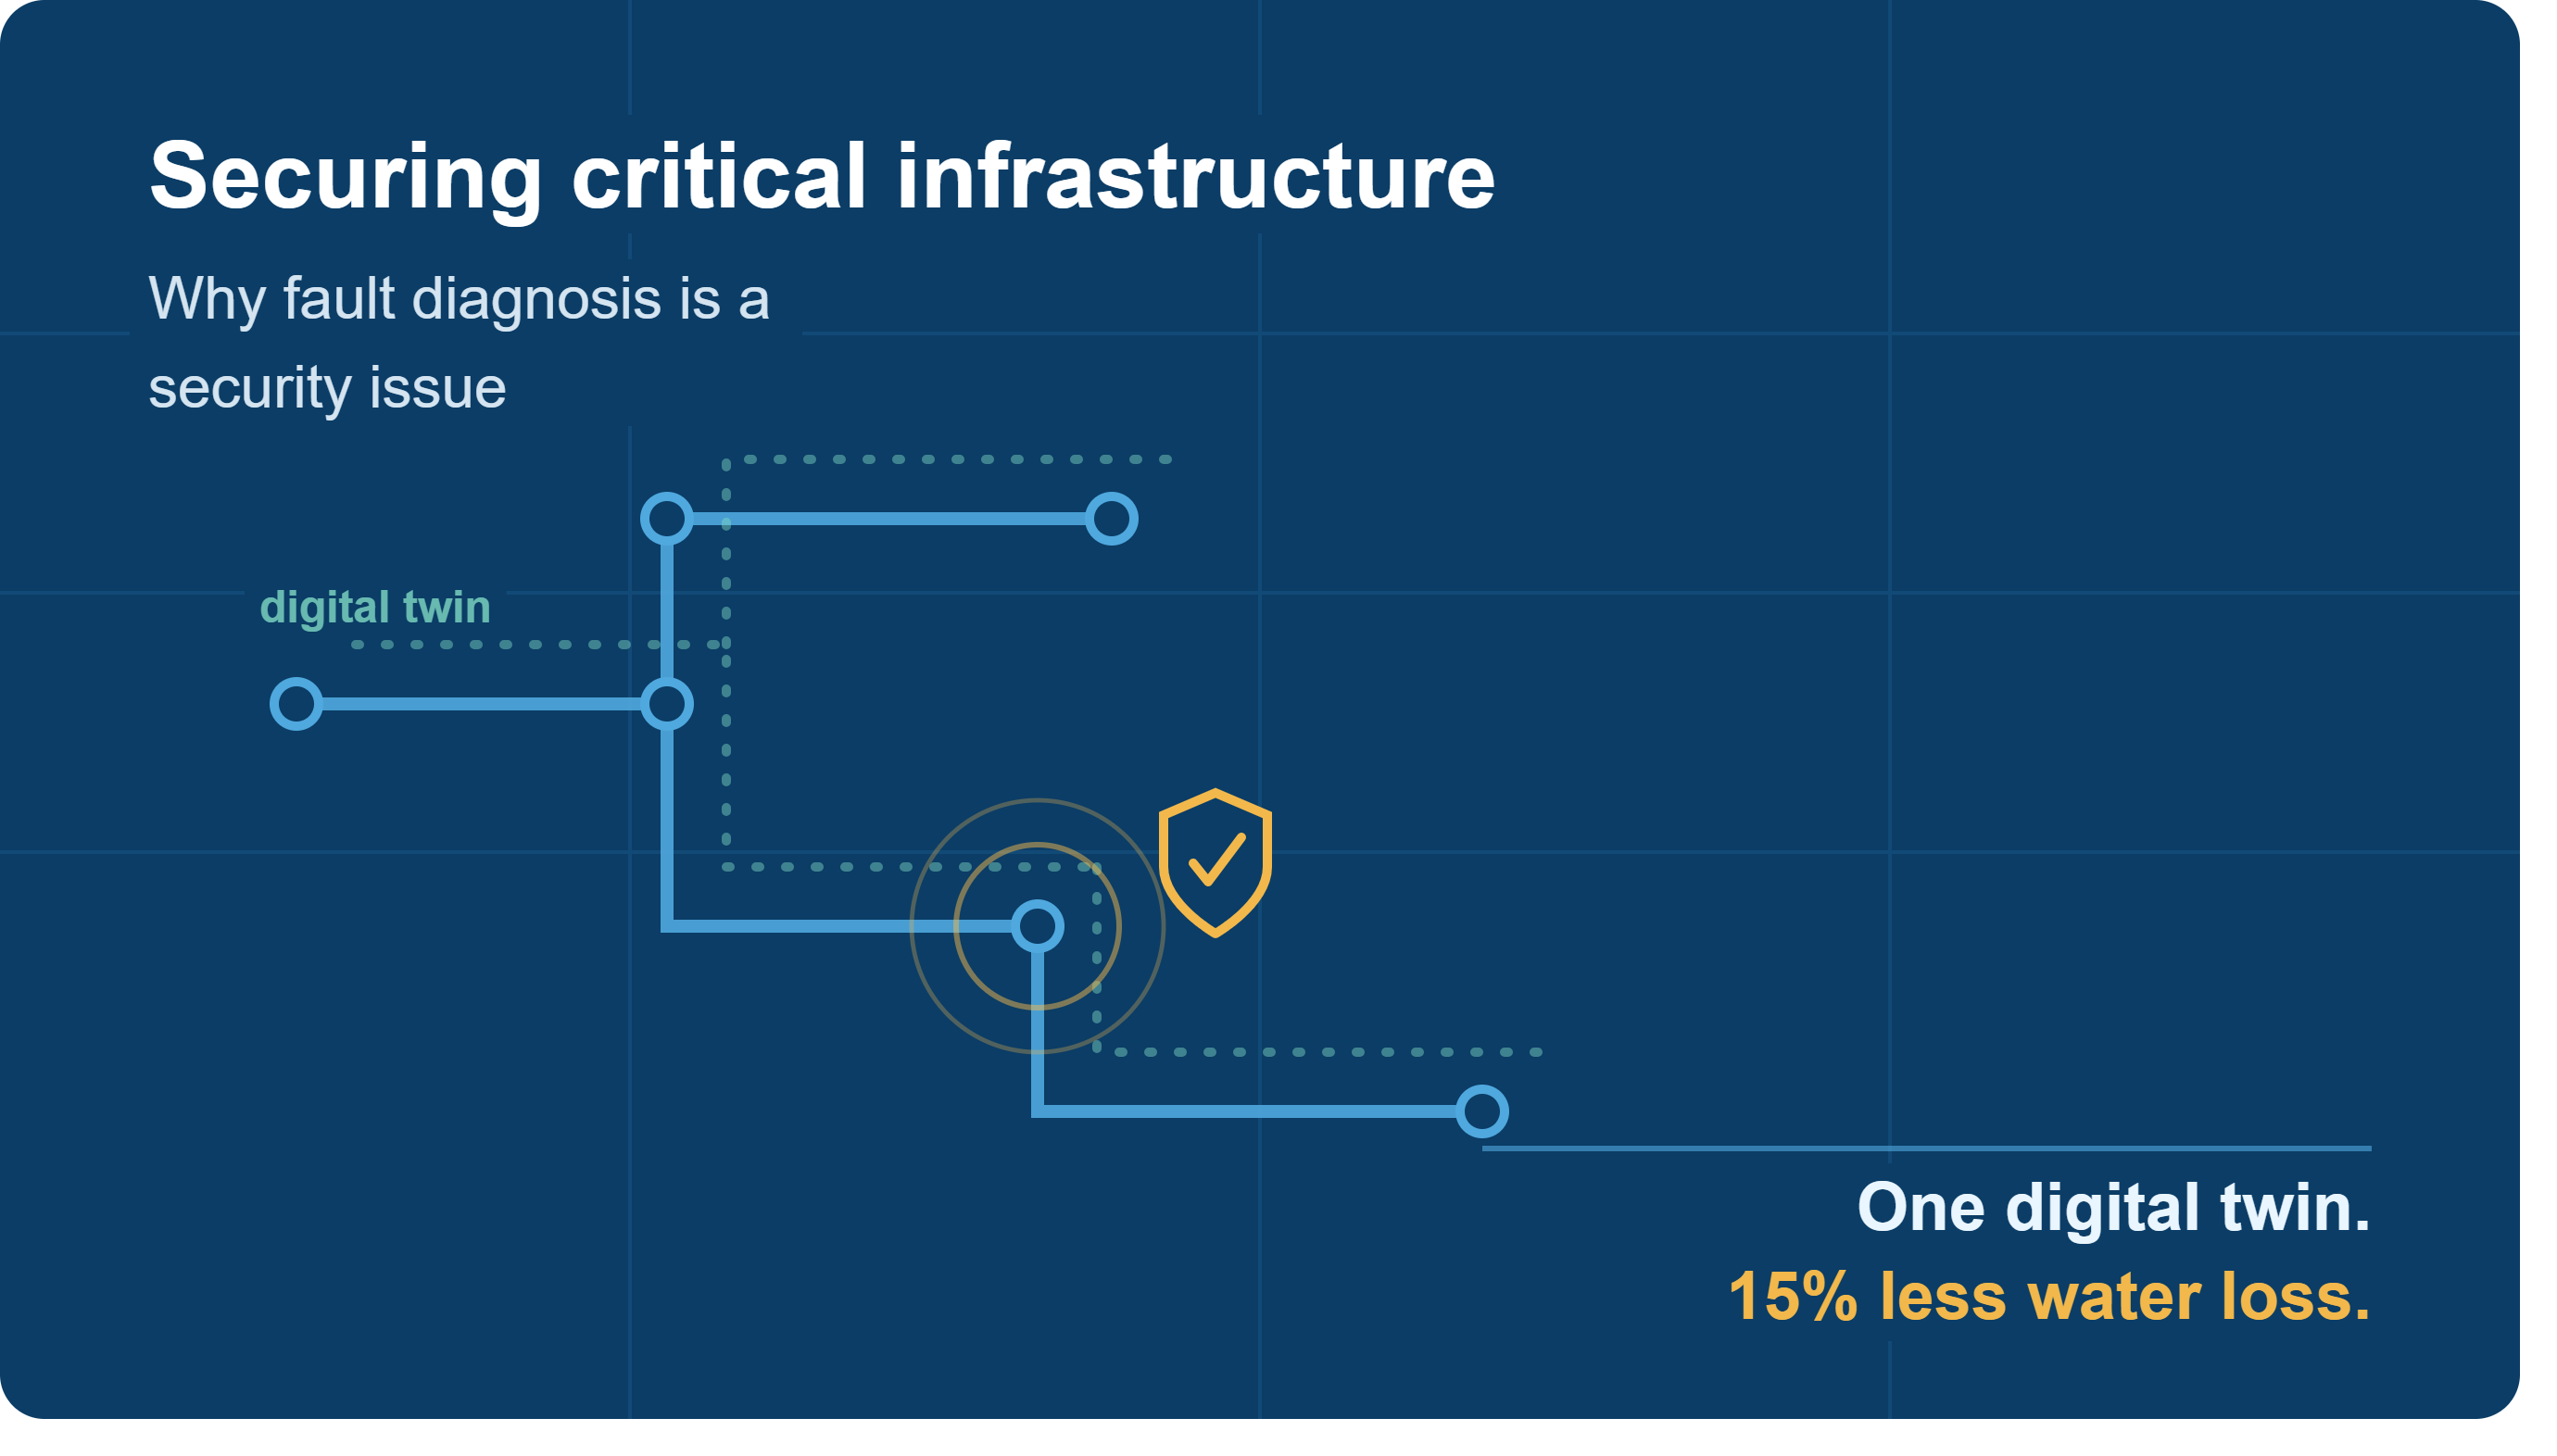
Dams are where the story starts. Downstream, water moves through distribution networks and that is where PHOEBE works. Its Cyprus pilot in the WATERVERSE project covered a water digital twin and water analytics tools, including PHOEBE's WaterAnalytics tool. The habit from the dams carries over: an average across a whole network can hide the district where pressure is dropping, just as a national percentage hides a dam at 18%. That comparison is ours, not a result from the pilot.
Sources and further reading
- Politis (CNA), Cyprus dams at 39.3% capacity as water reserves remain above 2025, 5 September 2026
- Cyprus Mail, After rainfall, dam capacity reaches 14.1 per cent, February 2026
- Cyprus Mail, Reservoir levels over double from same time last year, 24 August 2026
- Cyprus Mail, Water levels higher at Larnaca and Famagusta reservoirs than last year, 2 October 2026
- CBN, Cyprus dams 33.9% full, better than last year but not quite satisfactory
- European Commission, WATERVERSE success story
- Water Europe, WATERVERSE Policy Brief 3